Installation on a Bare Metal OpenShift Cluster
This topic provides instructions for installing Portworx on a bare metal OpenShift cluster using the OpenShift Container Platform web console.
The following collection of tasks describe how to install Portworx on a bare metal OpenShift cluster:
- Get Portworx Container Images
- Install NFS Packages for Sharedv4
- Create a monitoring ConfigMap
- Generate Portworx Specification
- Install Portworx Operator using OpenShift Console
- Verify Portworx Pod Status
- Verify Portworx Cluster Status
- Verify Portworx Pool Status
- Verify pxctl Cluster Provision Status
Complete all the tasks to install Portworx.
Get Portworx Container Images
-
Use this procedure only to install Portworx on an air-gapped, bare metal OpenShift cluster.
-
Portworx by Pure Storage recommends to use the air-gapped-install bootstrap script to pull and push images to the customer's registry in the amd64-x86-64 architecture if the destination cluster nodes are also in the amd64-x86-64 architecture. However, if a Mac machine is used to run the air-gapped-install bootstrap script and the Mac is in the arm64 architecture, this may cause conflicts if the destination cluster is in the amd64-x86-64 architecture.
-
Run the following command to download a list of the released images:
curl -o images "https://install.portworx.com/$PXVER/images?kbver=$KBVER" -
Set an environment variable for your Kubernetes version:
KBVER=$(kubectl version --short | awk -Fv '/Server Version: / {print $3}') -
Set an environment variable to specify the latest major version of Portworx:
PXVER=<portworx-version> -
On an internet-connected host that matches the architecture and OS version of the Kubernetes cluster nodes intended for Portworx installation, download the air-gapped installation bootstrap script for the Kubernetes and Portworx versions:
curl -o px-ag-install.sh -L "https://install.portworx.com/$PXVER/air-gapped?kbver=$KBVER" -
Pull the container images for the Kubernetes and Portworx versions:
sh px-ag-install.sh pull -
Log in to docker:
docker login <your-private-registry> -
Push the container images to a private registry that is accessible to your air-gapped nodes. Do not include
http://in your private registry path:sh px-ag-install.sh push <your-registry-path>For example:
sh px-ag-install.sh push myregistry.net:5443Example for pushing image to a specific repo:
sh px-ag-install.sh push myregistry.net:5443/px-images
Create a version manifest configmap for the Portworx Operator
-
Download the Portworx version manifest:
curl -o versions.yaml "https://install.portworx.com/$<portworx-version>/version?kbver=$<kubernetes-version>&opver=$<operator-version>"Replace:
<portworx_version>with the Portworx version you want to use.<kubernetes-version>with the Kubernetes version you want to use.<operator-version>with the Operator version you want to use.
-
(Optional) If your installation uses images from multiple custom registries, update the version manifest with the custom registry location details. You can use a DNS hostname and domain, or IP addresses (IPv4 or IPv6), to specify the container registry server in the following format:
<dns-host.domain or IPv4 or IPv6>[:<port>]/repository/image:tagThe following example demonstrates registries using a custom DNS hostname + domain, IPv4, and IPv6:
version: 2.13.3
components:
  stork: custom-registry.acme.org/portworx/backup/stork:23.2.1
  autopilot: 192.168.1.2:5433/tools/autopilot:1.3.7
nodeWiper: [2001:db8:3333:4444:5555:6666:7777:8888]:5443/portworx/px-node-wiper:2.13.2note-
Ensure that the Custom Container Registry Location field in the Customize tab of Portworx Central is empty for any specs you generate in the spec generator.
-
kubeScheduler,kubeControllerManager, andpausemay not appear in the version manifest, but you can include them in thepx-versionconfigmap:...
kubeScheduler: custom-registry.acme.org/k8s/kube-scheduler-amd64:v1.26.4
kubeControllerManager: custom-registry.acme.org/k8s/kube-controller-manager-amd64:v1.26.4
pause: custom-registry.acme.org/k8s/pause:3.1
-
-
Create a configmap from the downloaded or updated version manifest in the namespace
<px-namespace>, where you deploy Portworx:kubectl -n <px-namespace> create configmap px-versions --from-file=versions.yaml
Install NFS packages for Sharedv4
Use this procedure only to install Portworx on an air-gapped, bare metal OpenShift cluster.
To install the NFS package on your host systems so that Portworx can use the sharedv4 feature, follow these steps:
-
Start the repository container as a standalone service in Docker by running the following command:
docker run -p 8080:8080 docker.io/portworx/px-repo:1.2.0 -
Using a browser within your air-gapped environment, navigate to your host IP address where the above docker image is running (For example,
http://<ip-address>:8080), and follow the instructions for your Linux distribution provided by the container to configure your host to use the package repository service, and install the NFS packages.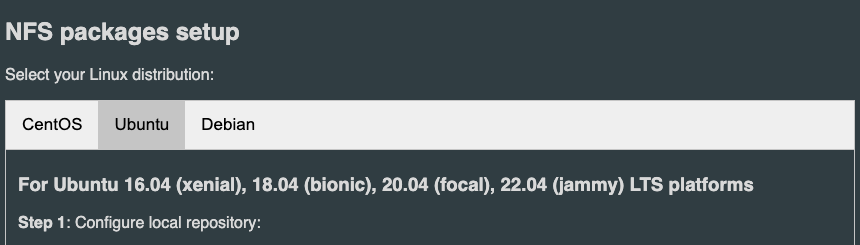
Create a Monitoring ConfigMap
Enable monitoring for user-defined projects before installing the Portworx Operator. Use the instructions in this section to configure the OpenShift Prometheus deployment to monitor Portworx metrics.
To integrate OpenShift’s monitoring and alerting system with Portworx, create a cluster-monitoring-config ConfigMap in the openshift-monitoring namespace:
apiVersion: v1
kind: ConfigMap
metadata:
  name: cluster-monitoring-config
  namespace: openshift-monitoring
data:
  config.yaml: |
    enableUserWorkload: true
The enableUserWorkload parameter enables monitoring for user-defined projects in the OpenShift cluster. This creates a prometheus-operated service in the openshift-user-workload-monitoring namespace.
Generate Portworx Specification
To install Portworx, you must first generate Kubernetes manifests that you will deploy in your bare metal OpenShift cluster by following these steps.
-
Sign in to the Portworx Central console.
The system displays the Welcome to Portworx Central! page. -
In the Portworx Enterprise section, select Generate Cluster Spec.
The system displays the Generate Spec page. -
From the Portworx Version dropdown menu, select the Portworx version to install.
-
From the Platform dropdown menu, select DAS/SAN.
-
From the Distribution Name dropdown menu, select OpenShift 4+.
-
(Optional) To customize the configuration options and generate a custom specification, click Customize and perform the following steps:
noteTo continue without customizing the default configuration or generating a custom specification, proceed to Step 7.
- Basic tab:
-
To use an existing etcd cluster, do the following:
- Select the Your etcd details option.
- In the field provided, enter the host name or IP and port number. For example,
http://test.com.net:1234.
To add another etcd cluster, click the + icon.
noteYou can add up to three etcd clusters.
- Select one of the following authentication methods:
- Disable HTTPS – To use HTTP for etcd communication.
- Certificate Auth – To use HTTPS with an SSL certificate.
For more information, see Secure your etcd communication. - Password Auth – To use HTTPS with username and password authentication.
-
To use an internal Portworx-managed key-value store (kvdb), do the following:
- Select the Built-in option.
- To enable TLS encrypted communication among KVDB nodes and between Portworx nodes and the KVDB cluster, select the Enable TLS for internal kvdb checkbox.
- If your cluster does not already have a cert-manager, select the Deploy Cert-Manager for TLS certificates checkbox.
-
Click Next.
- Storage tab:
- To enable Portworx to use all available, unused, and unmounted drives on the node, do the following:
- Select the Automatically scan disks option.
- From the Default IO Profile dropdown menu, select Auto.
This enables Portworx to automatically choose the best I/O profile based on detected workload patterns. - Select the Use unmounted disks even if they have a partition or filesystem on it. Portworx will never use a drive or partition that is mounted checkbox to use unmounted disks, even if they contain a partition or filesystem.
Portworx will not use any mounted drive or partition.
- To manually specify the drives on the node for Portworx to use, do the following:
- Select the Manually specify disks option.
- In the Drive/Device field, specify the block drive(s) that Portworx uses for data storage.
To add another block drive, click the + icon. - (Optional) In the Pool Label field, assign a custom label in
key:valueformat to identify and categorize storage pools.
- (Optional) To enable the PX-StoreV2 datastore, select the PX-StoreV2 checkbox.
- If you select the PX-StoreV2 checkbox, in the Metadata Path field, enter a pre-provisioned path for storing the Portworx metadata.
The path must be at least 64 GB in size. - From the Journal Device dropdown menu, select one of the following:
- None – To use the default journaling setting.
- Auto – To automatically allocate journal devices.
- Custom – To manually enter a journal device path.
Enter the path of the journal device in the Journal Device Path field.
- Skip KVDB device - This checkbox is selected by default and appears only if you choose the Built-in option in the Basic tab.
Keep it selected to use the same device for KVDB and storage I/O. This configuration is suitable for test or development clusters but not recommended for production clusters. For production clusters, clear the checkbox and provide a separate device to store internal KVDB data. This separates KVDB I/O from storage I/O and improves performance. - KVDB device - Enter the block device path to be used exclusively for KVDB data.
This field appears only if you clear the Skip KVDB device checkbox. The KVDB device must be present on at least three nodes in the cluster to ensure high availability.noteTo restrict Portworx to run internal KVDB only on specific nodes, label those nodes with:
kubectl label nodes node1 node2 node3 px/metadata-node=true - Click Next.
- To enable Portworx to use all available, unused, and unmounted drives on the node, do the following:
- Network tab:
- In the Interface(s) section, do the following:
- Enter the Data Network Interface to be used for data traffic.
- Enter the Management Network Interface to be used for management traffic.
- In the Advanced Settings section, do the following:
- Enter the Starting port for Portworx services.
- Click Next.
- In the Interface(s) section, do the following:
- Deployment tab:
- In the Kubernetes Distribution section, under Are you running on either of these?, select Openshift 4+.
- In the Component Settings section:
- Select the Enable Stork checkbox to enable Stork.
- Select the Enable Monitoring checkbox to enable Prometheus-based monitoring of Portworx components and resources.
- To configure how Prometheus is deployed and managed in your cluster, choose one of the following:
- Portworx Managed - To enable Portworx to install and manage Prometheus and Operator automatically.
Ensure that no another Prometheus Operator instance already running on the cluster. - User Managed - To manage your own Prometheus stack.
You must enter a valid URL of the Prometheus instance in the Prometheus URL field.
- Portworx Managed - To enable Portworx to install and manage Prometheus and Operator automatically.
- Select the Enable Autopilot checkbox to enable Portworx Autopilot.
For more information on Autopilot, see Expanding your Storage Pool with Autopilot. - Select the Enable Telemetry checkbox to enable telemetry in the StorageCluster spec.
For more information, see Enable Pure1 integration for upgrades on bare metal. - Enter the prefix for the Portworx cluster name in the Cluster Name Prefix field.
- Select the Secrets Store Type from the dropdown menu to store and manage secure information for features such as CloudSnaps and Encryption.
- In the Environment Variables section, enter name-value pairs in the respective fields.
- In the Registry and Image Settings section:
- Enter the Custom Container Registry Location to download the Docker images.
- Enter the Kubernetes Docker Registry Secret that serves as the authentication to access the custom container registry.
- From the Image Pull Policy dropdown menu, select Default, Always, IfNotPresent, or Never.
This policy influences how images are managed on the node and when updates are applied.
- In the Security Settings section, select the Enable Authorization checkbox to enable Role-Based Access Control (RBAC) and secure access to storage resources in your cluster.
- Click Finish.
- In the summary page, enter a name for the specification in the Spec Name field, and tags in the Spec Tags field.
- Click Download .yaml to download the yaml file with the customized specification or Save Spec to save the specification.
-
- Basic tab:
-
Click Save & Download to generate the specification.
Install Portworx Operator using OpenShift Console
-
Sign in to the OpenShift Container Platform web console.
-
From the left navigation pane, select OperatorHub.
The system displays the OperatorHub page. -
Search for Portworx and select Portworx Enterprise.
The system displays the Portworx Enterprise page. -
Click Install.
The system initiates the Portworx Operator installation and displays the Install Operator page. -
In the Installation mode section, select A specific namespace on the cluster.
-
From the Installed Namespace dropdown, choose Create Project.
The system displays the Create Project window. -
Provide the name
portworxand click Create to create a namespace called portworx. -
In the Console plugin section, select Enable to manage your Portworx cluster using the Portworx dashboard within the OpenShift console.
If the Portworx Operator is installed but the OpenShift Console plugin is not enabled, or was previously disabled, you can re-enable it by running the following command.
oc patch console.operator cluster --type=json -p='[{"op":"add","path":"/spec/plugins/-","value":"portworx"}]'
- Click Install to deploy Portworx Operator in the
portworxnamespace.
After you successfully install Portworx Operator, the system displays the Create StorageCluster option.
Deploying Portworx using OpenShift Console
-
Click Create StorageCluster.
The system displays the Create StorageCluster page. -
Select YAML view.
-
Copy and paste the specification that you generated in Generate Portworx Specification section into the text editor.
-
Click Create.
The system deploys Portworx, and displays the Portworx instance in the Storage Cluster tab of the Installed Operators page.noteFor clusters with PX-StoreV2 datastores, after you deploy Portworx, the Portworx Operator performs a pre-flight check across the cluster, and the check must pass on each node. This check determines whether each node in the cluster is compatible with the PX-StoreV2 datastore. If each node meets the following hardware and software requirements, PX-StoreV2 is automatically set as the default datastore during Portworx installation.
- Hardware:
- CPU: A minimum of 8 cores CPU per node.
- Drive type: SD/NVME drive with a memory of more than 8 GB per node.
- Metadata device: A minimum of 64 GB system metadata device on each node.
- Software:
- Linux kernel version: 4.20 or later with the Rhel packages device-mapper mdadm lvm2 device-mapper-persistent-data augeas
- Hardware:
Verify Portworx Pod Status
Run the following command to list and filter the results for Portworx pods and specify the namespace where you have deployed Portworx:
oc get pods -n <px-namespace> -o wide | grep -e portworx -e px
NAME                                                    READY   STATUS    RESTARTS         AGE     IP              NODE                         NOMINATED NODE   READINESS GATES
portworx-api-8scq2                                      1/1     Running   0                5h1m    xx.xx.xxx.xxx   username-vms-silver-sight-0   <none>           <none>
portworx-api-f24b9                                      1/1     Running   0                5h1m    xx.xx.xxx.xxx   username-vms-silver-sight-3   <none>           <none>
portworx-api-f95z5                                      1/1     Running   0                5h1m    xx.xx.xxx.xxx   username-vms-silver-sight-2   <none>           <none>
portworx-kvdb-558g5                                     1/1     Running   0                3m46s   xx.xx.xxx.xxx   username-vms-silver-sight-2   <none>           <none>
portworx-kvdb-9tfjd                                     1/1     Running   0                2m57s   xx.xx.xxx.xxx   username-vms-silver-sight-0   <none>           <none>
portworx-kvdb-cjcxg                                     1/1     Running   0                3m7s    xx.xx.xxx.xxx   username-vms-silver-sight-3   <none>           <none>
portworx-operator-548b8d4ccc-qgnkc                      1/1     Running   0                5h2m    xx.xx.xxx.xxx   username-vms-silver-sight-0   <none>           <none>
portworx-pvc-controller-ff669698-62ngd                  1/1     Running   0                5h1m    xx.xx.xxx.xxx   username-vms-silver-sight-3   <none>           <none>
portworx-pvc-controller-ff669698-6b4zj                  1/1     Running   0                5h1m    xx.xx.xxx.xxx   username-vms-silver-sight-2   <none>           <none>
portworx-pvc-controller-ff669698-pffvl                  1/1     Running   0                5h1m    xx.xx.xxx.xxx   username-vms-silver-sight-0   <none>           <none>
prometheus-px-prometheus-0                              2/2     Running   0                5h      xx.xx.xxx.xxx   username-vms-silver-sight-0   <none>           <none>
px-cluster-378d7ae1-f4ca-xxxx-xxxx-xxxxxxxxxxxx-2qsp4   2/2     Running   0                3h20m   xx.xx.xxx.xxx   username-vms-silver-sight-3   <none>           <none>
px-cluster-378d7ae1-f4ca-xxxx-xxxx-xxxxxxxxxxxx-5vnzv   2/2     Running   0                3h20m   xx.xx.xxx.xxx   username-vms-silver-sight-0   <none>           <none>
px-cluster-378d7ae1-f4ca-xxxx-xxxx-xxxxxxxxxxxx-lxzd5   2/2     Running   0                3h20m   xx.xx.xxx.xxx   username-vms-silver-sight-2   <none>           <none>
px-csi-ext-77fbdcdcc9-7hkpm                             4/4     Running   0                3h19m   xx.xx.xxx.xxx   username-vms-silver-sight-3   <none>           <none>
px-csi-ext-77fbdcdcc9-9ck26                             4/4     Running   0                3h18m   xx.xx.xxx.xxx   username-vms-silver-sight-0   <none>           <none>
px-csi-ext-77fbdcdcc9-ddmjr                             4/4     Running   0                3h20m   xx.xx.xxx.xxx   username-vms-silver-sight-2   <none>           <none>
px-prometheus-operator-7d884bc8bc-5sv9r                 1/1     Running   0                5h1m    xx.xx.xxx.xxx   username-vms-silver-sight-0   <none>           <none>
Note the name of a px-cluster pod. You will run pxctl commands from these pods in Verify Portworx Cluster Status.
Verify Portworx Cluster Status
You can find the status of the Portworx cluster by running pxctl status commands from a pod.
Enter the following oc exec command, specifying the pod name you retrieved in Verify Portworx Pod Status:
oc exec <px-pod-name> -n <px-namespace> -- /opt/pwx/bin/pxctl status
Defaulted container "portworx" out of: portworx, csi-node-driver-registrar
Status: PX is operational
Telemetry: Disabled or Unhealthy
Metering: Disabled or Unhealthy
License: Trial (expires in 31 days)
Node ID: 24508311-e2fe-xxxx-xxxx-xxxxxxxxxxxx
    IP: xx.xx.xxx.xxx
    Local Storage Pool: 1 pool
    POOL	IO_PRIORITY	RAID_LEVEL	USABLE	USED	STATUS	ZONE	REGION
    0	HIGH		raid0		25 GiB	33 MiB	Online	default	default
    Local Storage Devices: 1 device
    Device	Path		Media Type		Size		Last-Scan
    0:0	/dev/sda	STORAGE_MEDIUM_SSD	32 GiB		10 Oct 22 23:45 UTC
    total			-			32 GiB
    Cache Devices:
     * No cache devices
    Kvdb Device:
    Device Path	Size
    /dev/sdc	1024 GiB
     * Internal kvdb on this node is using this dedicated kvdb device to store its data.
    Metadata Device:
    1	/dev/sdd	STORAGE_MEDIUM_SSD	64 GiB
Cluster Summary
    Cluster ID: px-cluster-378d7ae1-f4ca-xxxx-xxxx-xxxxxxxxxxxx
    Cluster UUID: 482b18b1-2a8b-xxxx-xxxx-xxxxxxxxxxxx
    Scheduler: kubernetes
    Nodes: 3 node(s) with storage (3 online)
    IP		ID					SchedulerNodeName		Auth		StorageNode		Used	Capacity	Status	StorageStatus	Version		Kernel				OS
    xx.xx.xxx.xxx	24508311-e2fe-xxxx-xxxx-xxxxxxxxxxxx	username-vms-silver-sight-3	Disabled	Yes(PX-StoreV2)	33 MiB	25 GiB		Online	Up (This node)	3.2.0-28944c8	5.4.217-1.el7.elrepo.x86_64	CentOS Linux 7 (Core)
    xx.xx.xxx.xxx	1e89102f-0510-xxxx-xxxx-xxxxxxxxxxxx	username-vms-silver-sight-0	Disabled	Yes(PX-StoreV2)	33 MiB	25 GiB		Online	Up		3.2.0-28944c8	5.4.217-1.el7.elrepo.x86_64	CentOS Linux 7 (Core)
    xx.xx.xxx.xxx	0c99e1f2-9d49-xxxx-xxxx-xxxxxxxxxxxx	username-vms-silver-sight-2	Disabled	Yes(PX-StoreV2)	33 MiB	25 GiB		Online	Up		3.2.0-28944c8	5.4.217-1.el7.elrepo.x86_64	CentOS Linux 7 (Core)
Global Storage Pool
    Total Used    	:  99 MiB
    Total Capacity	:  74 GiB
Status displays PX is operational when the cluster is running as expected. If the cluster is using the PX-StoreV2 datastore, the StorageNode entries for each node displays Yes(PX-StoreV2).
Verify Portworx Pool Status
This procedure is applicable for clusters with PX-StoreV2 datastore.
Run the following command to view the Portworx drive configurations for your pod:
oc exec <px-pod> -n <px-namespace> -- /opt/pwx/bin/pxctl service pool show
Defaulted container "portworx" out of: portworx, csi-node-driver-registrar
PX drive configuration:
Pool ID: 0
    Type:  PX-StoreV2
    UUID:  58ab2e3f-a22e-xxxx-xxxx-xxxxxxxxxxxx
    IO Priority:  HIGH
    Labels:  kubernetes.io/arch=amd64,kubernetes.io/hostname=username-vms-silver-sight-3,kubernetes.io/os=linux,medium=STORAGE_MEDIUM_SSD,beta.kubernetes.io/arch=amd64,beta.kubernetes.io/os=linux,iopriority=HIGH
    Size: 25 GiB
    Status: Online
    Has metadata:  No
    Balanced:  Yes
    Drives:
    0: /dev/sda, Total size 32 GiB, Online
    Cache Drives:
    No Cache drives found in this pool
Metadata  Device:
    1: /dev/sdd, STORAGE_MEDIUM_SSD
The output Type: PX-StoreV2 ensures that the pod uses the PX-StoreV2 datastore.
Verify pxctl Cluster Provision Status
-
Access the Portworx CLI.
-
Run the following command to find the storage cluster:
oc -n <px-namespace> get storageclusterNAME CLUSTER UUID STATUS VERSION AGE
px-cluster-378d7ae1-f4ca-xxxx-xxxx-xxxxxxxxxxxx 482b18b1-2a8b-xxxx-xxxx-xxxxxxxxxxxx Online 3.2.0-dev-rc1 5h6mThe status must display the cluster is
Online. -
Run the following command to find the storage nodes:
oc -n <px-namespace> get storagenodesNAME ID STATUS VERSION AGE
username-vms-silver-sight-0 1e89102f-0510-xxxx-xxxx-xxxxxxxxxxxx Online 3.2.0-28944c8 3h25m
username-vms-silver-sight-2 0c99e1f2-9d49-xxxx-xxxx-xxxxxxxxxxxx Online 3.2.0-28944c8 3h25m
username-vms-silver-sight-3 24508311-e2fe-xxxx-xxxx-xxxxxxxxxxxx Online 3.2.0-28944c8 3h25mThe status must display the nodes are
Online. -
Verify the Portworx cluster provision status by running the following command.
Specify the pod name you retrieved in Verify Portworx Pod Status.oc exec <px-pod> -n <px-namespace> -- /opt/pwx/bin/pxctl cluster provision-statusNODE NODE STATUS POOL POOL STATUS IO_PRIORITY SIZE AVAILABLE USED PROVISIONED ZONE REGION RACK
0c99e1f2-9d49-xxxx-xxxx-xxxxxxxxxxxx Up 0 ( 8ec9e6aa-7726-xxxx-xxxx-xxxxxxxxxxxx ) Online HIGH 32 GiB 32 GiB 33 MiB 0 B default default default
1e89102f-0510-xxxx-xxxx-xxxxxxxxxxxx Up 0 ( 06fcc73a-7e2f-xxxx-xxxx-xxxxxxxxxxxx ) Online HIGH 32 GiB 32 GiB 33 MiB 0 B default default default
24508311-e2fe-xxxx-xxxx-xxxxxxxxxxxx Up 0 ( 58ab2e3f-a22e-xxxx-xxxx-xxxxxxxxxxxx ) Online HIGH 32 GiB 32 GiB 33 MiB 0 B default default default
What to do next
Create a PVC. For more information, see Create your first PVC.